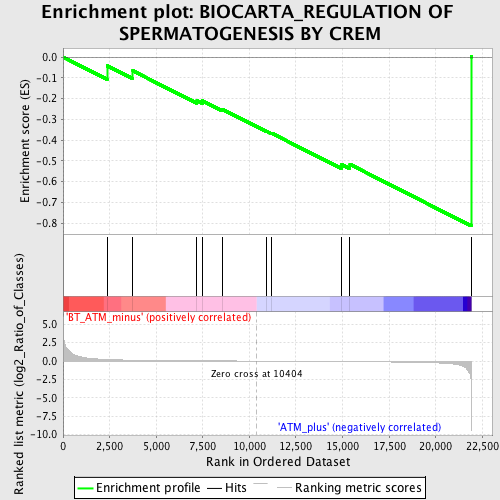
Profile of the Running ES Score & Positions of GeneSet Members on the Rank Ordered List
| Dataset | Set_02_BT_ATM_minus_versus_ATM_plus.phenotype_BT_ATM_minus_versus_ATM_plus.cls #BT_ATM_minus_versus_ATM_plus.phenotype_BT_ATM_minus_versus_ATM_plus.cls #BT_ATM_minus_versus_ATM_plus_repos |
| Phenotype | phenotype_BT_ATM_minus_versus_ATM_plus.cls#BT_ATM_minus_versus_ATM_plus_repos |
| Upregulated in class | ATM_plus |
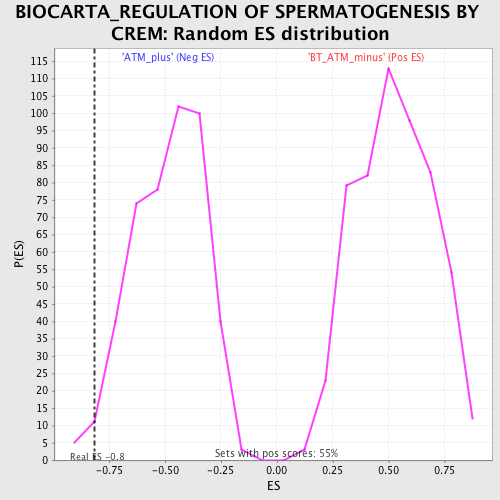
| GeneSet | BIOCARTA_REGULATION OF SPERMATOGENESIS BY CREM |
| Enrichment Score (ES) | -0.81420237 |
| Normalized Enrichment Score (NES) | -1.6760241 |
| Nominal p-value | 0.017660044 |
| FDR q-value | 0.27729166 |
| FWER p-Value | 0.981 |
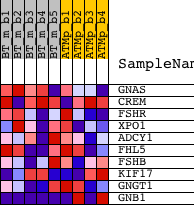
| PROBE | DESCRIPTION (from dataset) | GENE SYMBOL | GENE_TITLE | RANK IN GENE LIST | RANK METRIC SCORE | RUNNING ES | CORE ENRICHMENT | |
|---|---|---|---|---|---|---|---|---|
| 1 | GNAS | 1421740_at 1427789_s_at 1443007_at 1443375_at 1444767_at 1450186_s_at 1453413_at | 2363 | 0.216 | -0.0417 | No | ||
| 2 | CREM | 1418322_at 1430598_at 1430847_a_at 1449037_at | 3745 | 0.125 | -0.0665 | No | ||
| 3 | FSHR | 1450810_at | 7187 | 0.045 | -0.2096 | No | ||
| 4 | XPO1 | 1418442_at 1418443_at 1448070_at | 7471 | 0.041 | -0.2101 | No | ||
| 5 | ADCY1 | 1445112_at 1445359_at 1456487_at 1457251_x_at 1457329_at | 8534 | 0.025 | -0.2509 | No | ||
| 6 | FHL5 | 1449332_at | 10918 | -0.007 | -0.3575 | No | ||
| 7 | FSHB | 1450996_at | 11179 | -0.010 | -0.3662 | No | ||
| 8 | KIF17 | 1419826_at 1419827_s_at 1422762_at | 14963 | -0.064 | -0.5191 | Yes | ||
| 9 | GNGT1 | 1425167_a_at 1425168_at 1425219_x_at 1451633_a_at | 15403 | -0.072 | -0.5172 | Yes | ||
| 10 | GNB1 | 1417432_a_at 1425908_at 1454696_at 1459442_at | 21915 | -2.671 | 0.0009 | Yes |